Tweaking OpenTelemetry tracing in .NET
Fun with OpenTelemetry tracing - to err, or not to err
The OpenTelemetry libraries let you set up logging, (distributed) tracing, and metrics for .NET apps quite easily. In this post I focus on tracing - specifically on how to tweak the activity status for HTTP requests which return 4xx status codes. In this scenario, 401 responses that are part of an authentication handshake (OCI / Docker registry token flow) are expected - so we do not want them flagged as errors.
Tracing in OpenTelemetry
You’ve probably seen distributed trace graphs generated with OpenTelemetry and visualized in Jaeger, somewhere in Grafana, or the Aspire Dashboard. They provide a correlated view of nested spans across services and process boundaries. I find these especially valuable in dev or staging environments.
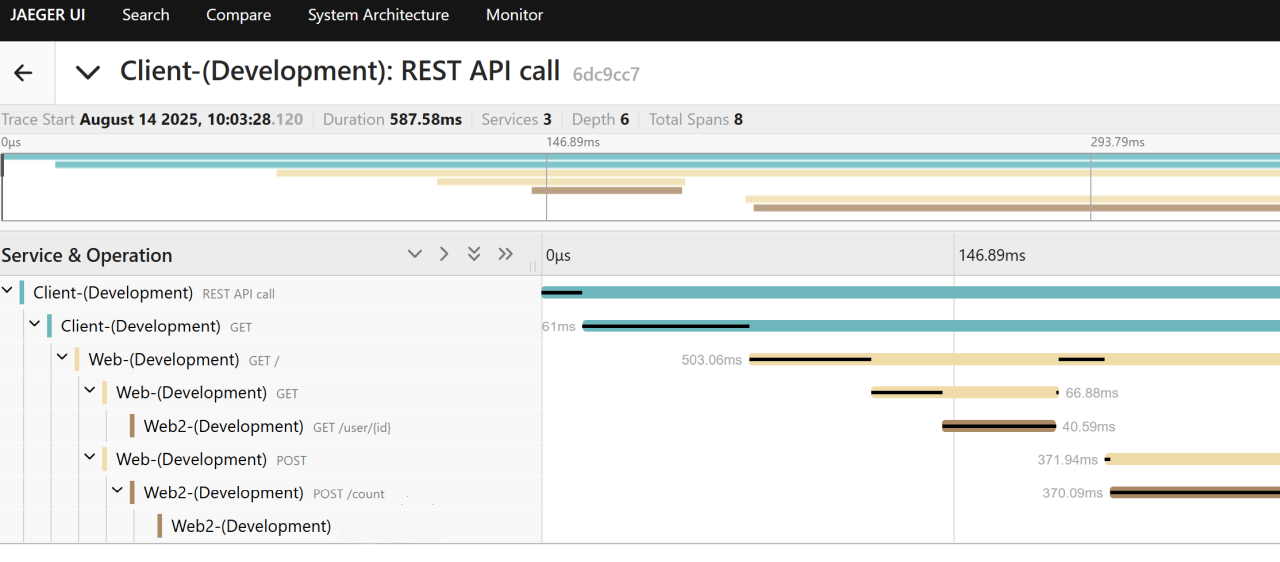
OpenTelemetry tracing is a standardized framework for collecting and correlating trace data across applications, libraries, and services. It works by instrumenting code to create spans—units of work that record timing, metadata, and context for operations such as HTTP requests or database calls. By propagating trace context (trace ID / span ID) via HTTP headers like traceparent and tracestate, OpenTelemetry enables distributed tracing: you can follow a request’s journey across process and service boundaries. This yields end-to-end visibility, helping diagnose latency, failure hotspots, and dependency issues.
OpenTelemetry for .NET provides several prebuilt instrumentation packages that automatically generate trace data for common libraries and frameworks, including:
OpenTelemetry.Instrumentation.AspNetCoreOpenTelemetry.Instrumentation.HttpOpenTelemetry.Instrumentation.SqlClientOpenTelemetry.Instrumentation.Npgsql
These hook into framework events to create spans with metadata (query text, URLs, status codes, timing, protocol, etc.) without requiring manual tracing code.
The distributed trace is then annotated with specific metadata. For HttpClient outbound requests, data points like status code, URL, method, and timing are recorded.
The authentication handshake … better to err with caution
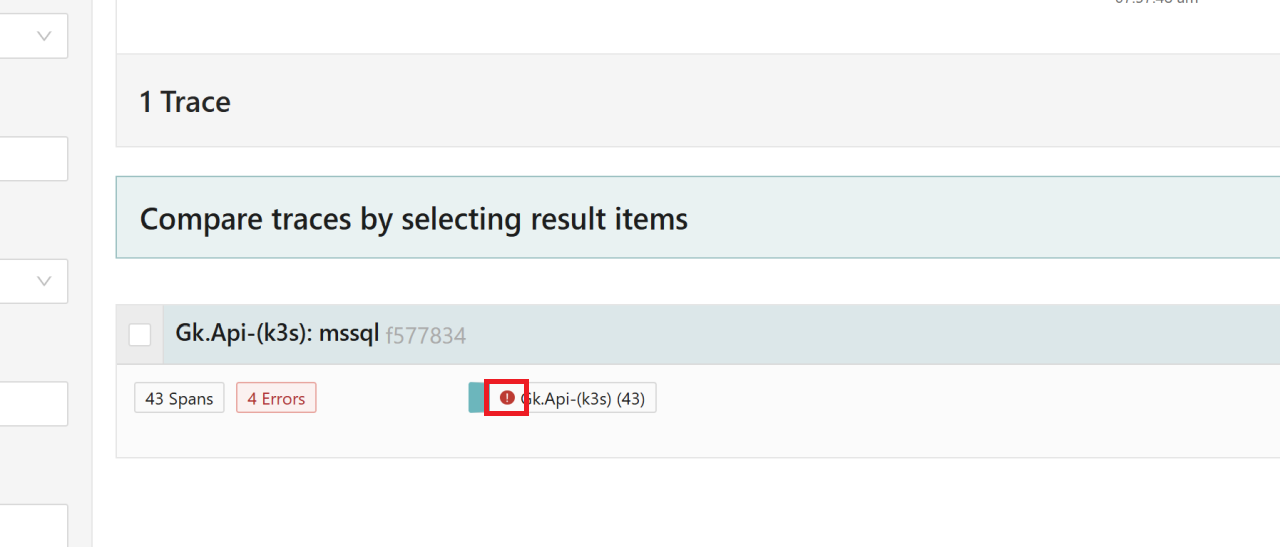
Looking at the traces in Jaeger, trace trees that contain spans with an error status are marked (red exclamation mark with a count). That invites a drill-down.
With HttpClient instrumentation (OpenTelemetry.Instrumentation.Http) any outbound HTTP request returning a 4xx or 5xx status automatically sets the span status to Error (ActivityStatusCode.Error). A 401 is therefore surfaced as an error.
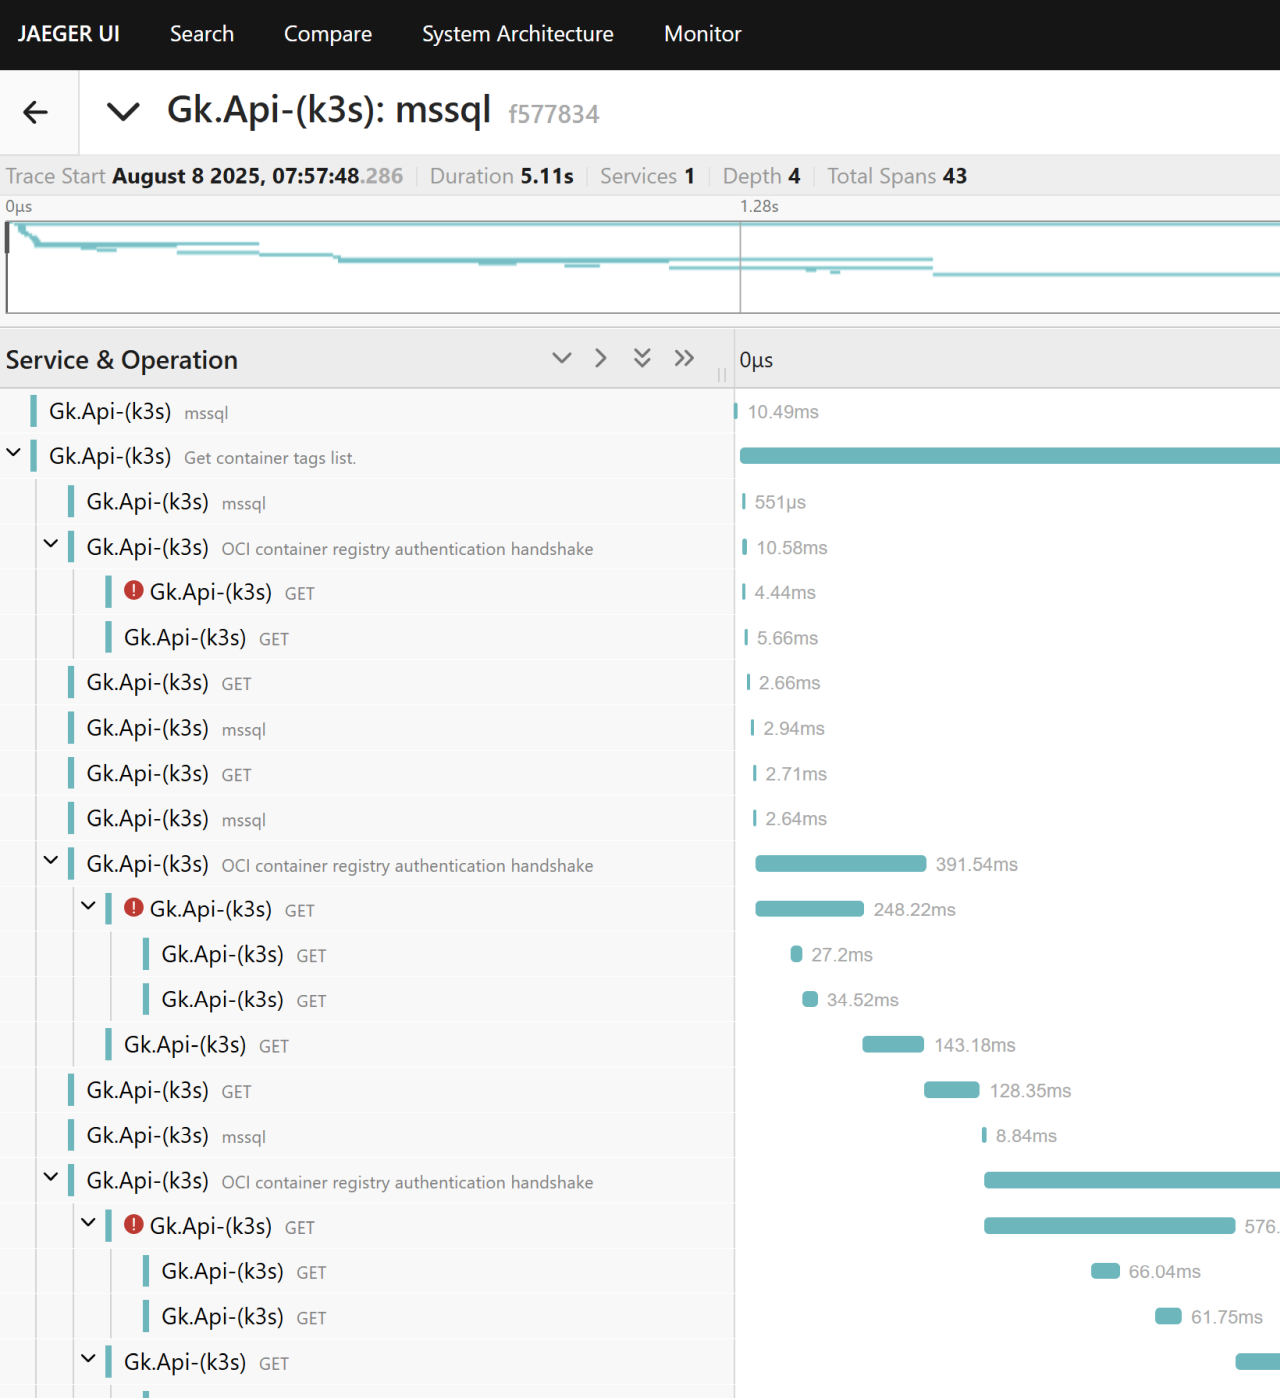
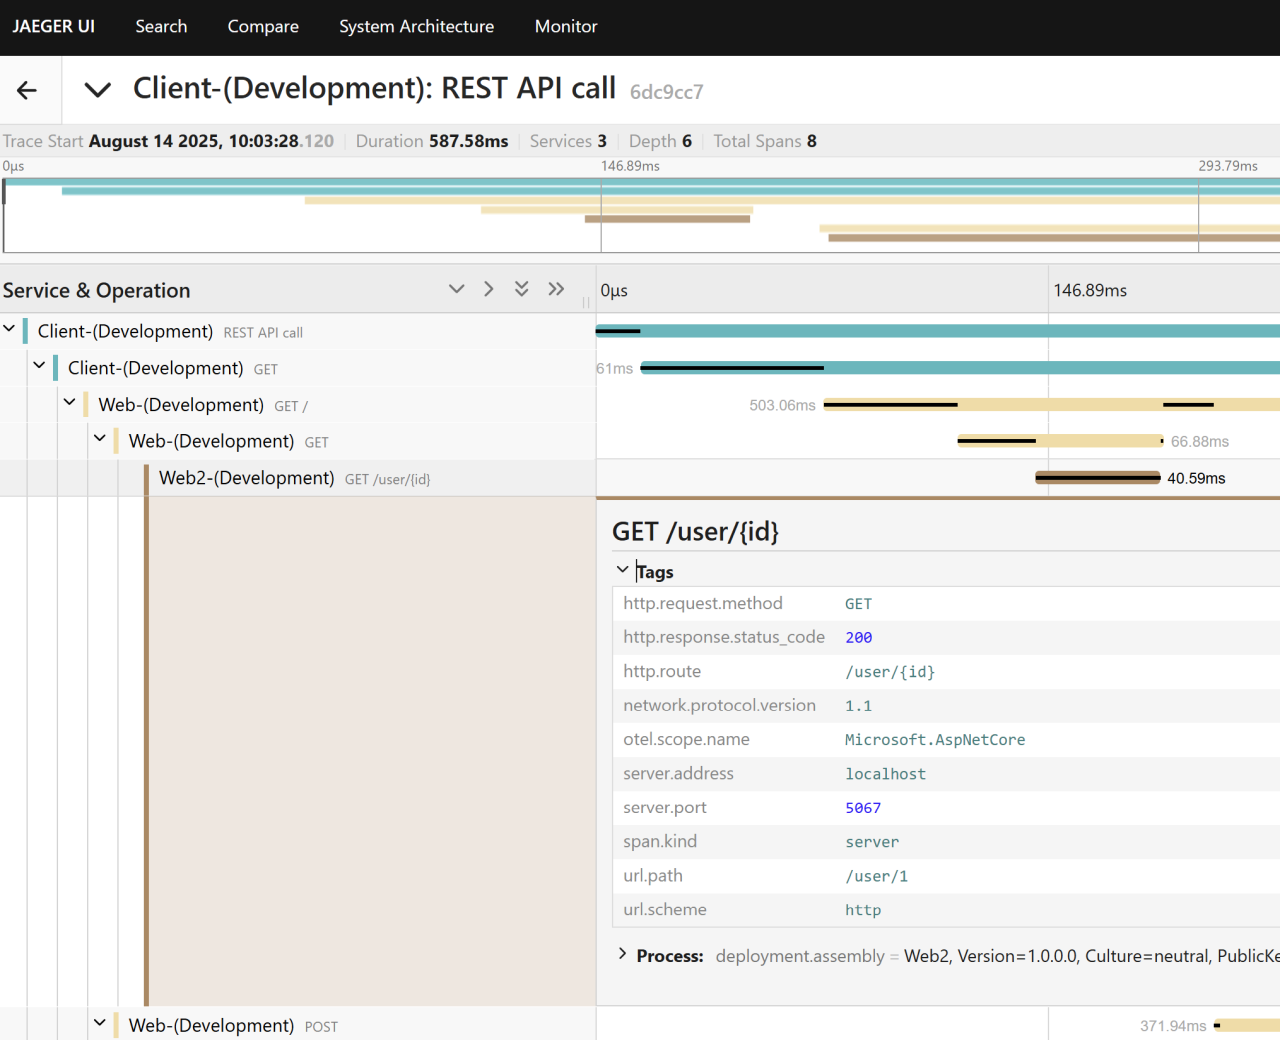
Expanding the details:
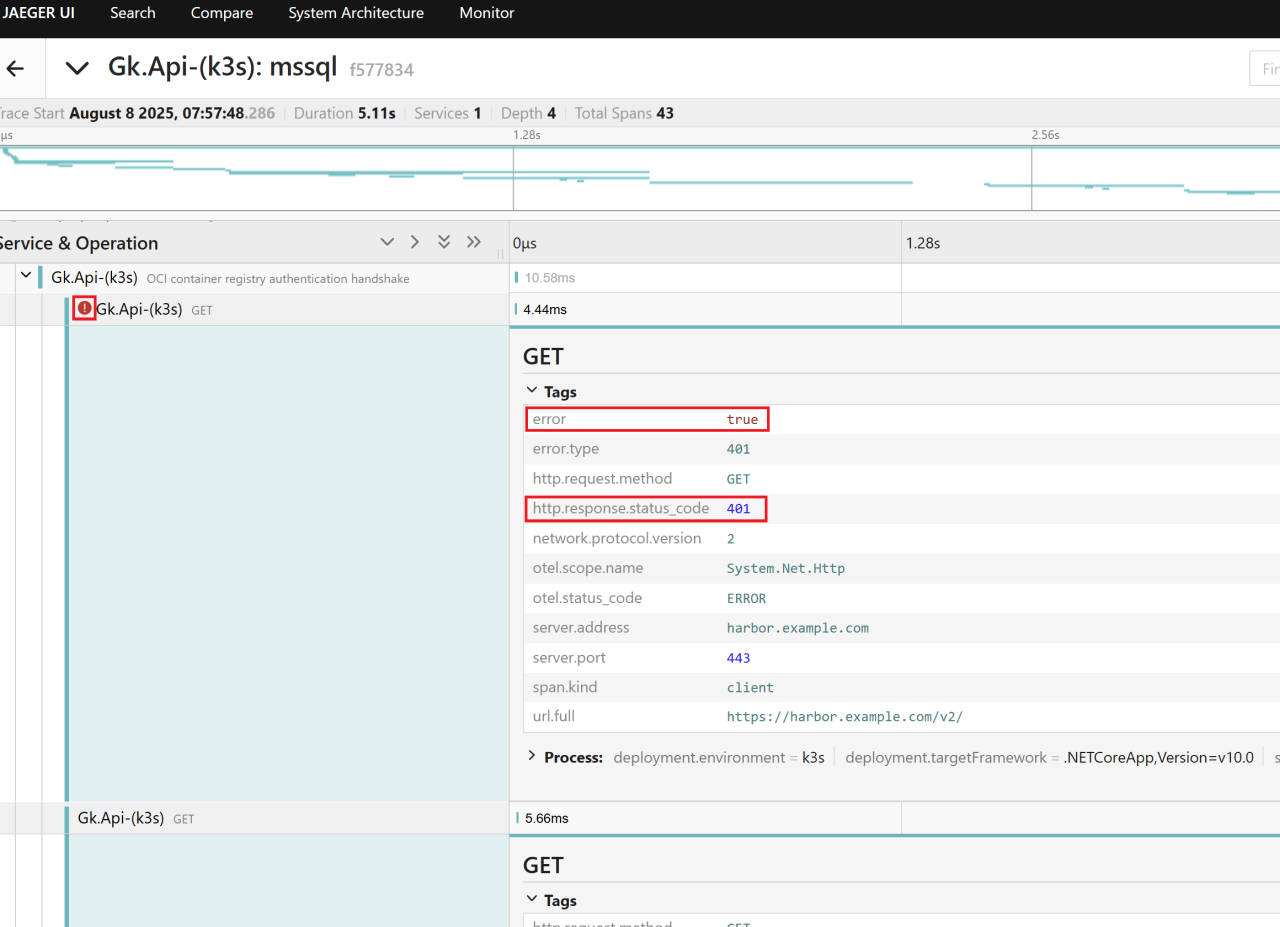
Not every 401 is created equal
During many authentication handshakes the client intentionally sends an initial unauthenticated request; the server returns 401 plus headers indicating the authentication scheme / realm. The client then sends the proper credentials and (in this case) retrieves a bearer token. The initial 401 is an expected step - not a failure.
Typical flow (simplified):
- Client request (no auth) → 401 (with auth challenge)
- Client follow-up (with credentials / token request) → 200 (token)
- Subsequent authenticated requests → 200 (or status codes which indicate redirection)…
As these distributed traces can be especially helpful at identifying errors and root causes, diluting them with spans marked as errors that do not require intervention can be distracting.
Let’s try to change the behavior.
Different Ways to Skin a Cat … approaches considered
OpenTelemetry involves different components working together.
| Approach | Idea | Pros | Cons | Rating |
|---|---|---|---|---|
| Ignore | Do nothing; accept error spans | Simple | Permanent false-positive noise at trace + error counts | 2/10 |
| Suppress instrumentation | Use SuppressInstrumentationScope for those calls |
Removes noise entirely | Loses timing + metadata; hides real failures inside handshake call | 4/10 |
| Processor post-adjust | Custom BaseProcessor<Activity> sets status = Ok for expected 401 |
Retains span + timing; selective | Requires tagging/identification logic | 7/10 |
| AsyncLocal to propagate context + Processor post-adjust | Use AsyncLocal to propagate context, then use processor to filter based on AsyncLocal stored information | Alternative identification logic | Should work similar to accessing parent activity. Better control. | 8/10 |
| Filter (instrumentation options) | Skip spans with a path pattern | Easy if identifiable by URL | Not robust (multiple registries / ambiguous paths) | Not feasible |
| Baggage | Use Baggage to flow context | Automatic propagation | Spills / Leaks as HTTP headers | 2/10 |
| Manual span + suppression | Manually create span; suppress default Http span | Full control of status & tags | More code; must replicate HTTP metadata if desired | 6/10 |
… (with other options available)
Current chosen solution: custom processor
A processor in OpenTelemetry lets you mutate activity state just before export. In this case, identifying the activities that need to be marked is the hard part.
To be able to identify whether an activity is part of an authentication handshake or not, we need additional context. We only want 401 that are part of an authentication handshake to display as ok, while other 401 should still be annotated as error. The creation of the activity itself is beyond our control, as it is created by the code from the OpenTelemetry.Instrumentation.Http package.
Two approaches:
Annotating a parent activity
- Tag the parent activity to indicate an OCI registry auth flow:
gk.oci.auth=true. - In
OnEnd, forHttpClientspans with status=Error ANDhttp.response.status_code==401AND parent tag present → set status to Ok with a descriptive message.
public sealed class OciContainerRegAuthHandshakeProcessor : BaseProcessor<Activity>
{
    public override void OnEnd(Activity data)
    {
        if (data is null) return;
        if (data.Status != ActivityStatusCode.Error) return;

        // The instrumentation uses int for the status code tag.
        if (data.GetTagItem("http.response.status_code") is int statusCode && statusCode == 401)
        {
            var parent = data.Parent;
            if (parent?.GetTagItem("gk.oci.auth") is bool isAuth && isAuth)
            {
                data.SetStatus(ActivityStatusCode.Ok, "OCI registry auth handshake: initial 401 expected");
            }
        }
    }
}
Registration (example builder snippet):
services.AddOpenTelemetry()
    .WithTracing(builder => builder
        .AddSource("Cloudsiders.*")
        .AddHttpClientInstrumentation()
        .AddProcessor<OciContainerRegAuthHandshakeProcessor>()
        .AddOtlpExporter());
When starting the auth flow (code you control), tag the current root / logical parent activity once:
Activity.Current?.SetTag("gk.oci.auth", true);
Using AsyncLocal to flow state to the processor
Instead of annotating a parent activity, with this approach we use AsyncLocal<T> instead. The processor remains mostly unchanged.
AsyncLocal<T> is a built-in .NET mechanism for storing data that flows with the async call context.
public sealed class OciAuthHandshake
{
    private static readonly AsyncLocal<bool> ScopeFlag = new();

    public static IDisposable Begin()
    {
        ScopeFlag.Value = true;
        return new ScopeGuard();
    }

    internal static bool IsActive => ScopeFlag.Value;

    private sealed class ScopeGuard : IDisposable
    {
        public void Dispose() => ScopeFlag.Value = false;
    }
}

public sealed class OciContainerRegAuthHandshakeProcessor : BaseProcessor<Activity>
{
    public override void OnEnd(Activity data)
    {
        if (data.Status != ActivityStatusCode.Error) {
            return;
        }

        var is401 = data.GetTagItem("http.response.status_code") is int xcode && xcode == 401;

        if (is401) {
            if (OciAuthHandshake.IsActive) {
                data.SetStatus(ActivityStatusCode.Ok, "OCI Container Registry Auth Handshake expected 401 response");
                return;
            }
        }
    }
}
Before starting the authentication handshake, we create and populate the AsyncLocal:
using var scope = OciAuthHandshake.Begin();
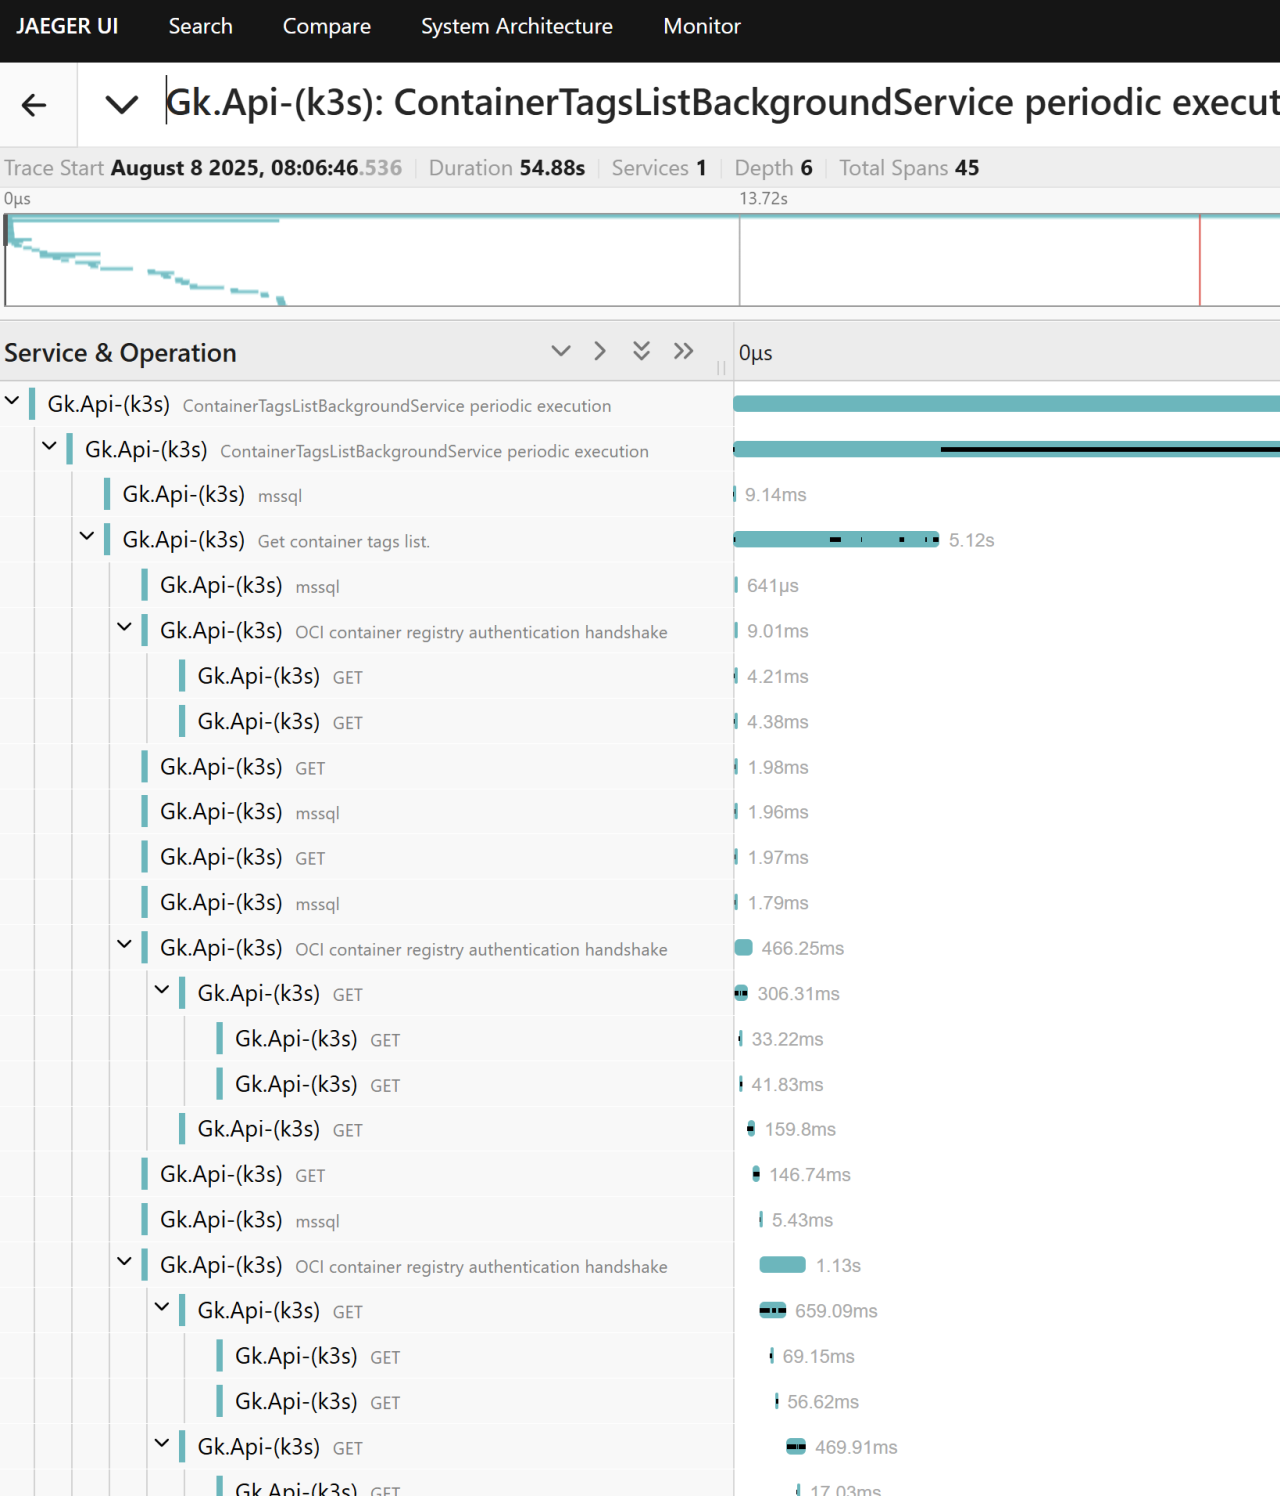
How does it look?
After applying the changes, the traces now look like this:
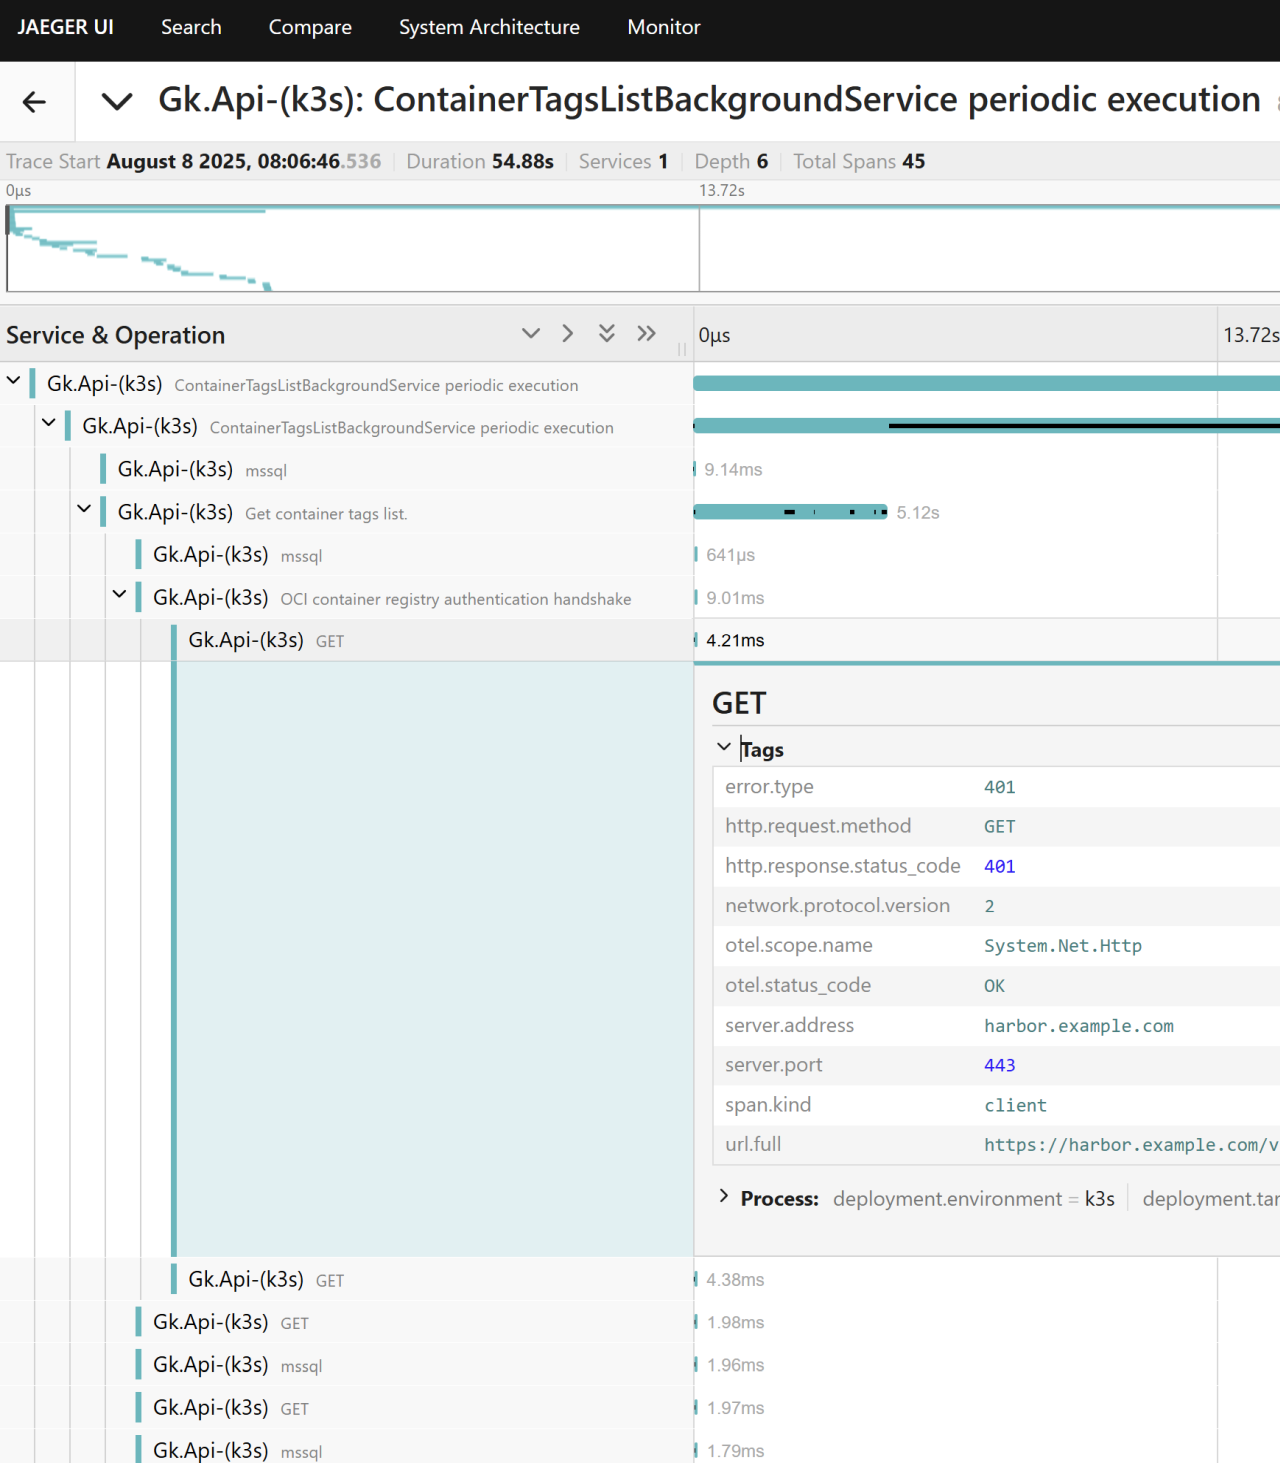
When drilling into the details view, we still get all metadata for the outbound HTTP request.
Alternative approaches
Some other ideas to tackle this issue come to mind. The list is not meant to be exhaustive. These may or may not be suited.
Why not DelegatingHandler tagging?
Adding a DelegatingHandler to the HttpClient handler pipeline and inspecting Activity.Current in SendAsync gives you the enclosing parent activity - the HttpClient instrumentation creates its span inside SendAsync (inside the primary message handler). There is no stable public hook to mutate the child span directly at creation time (short of replacing instrumentation itself). Thus: not viable for this precise mutation.
Alternative: manual span + suppression
If you need even finer control (e.g., multi-step handshake including multiple HTTP operations where only some should be visible):
private static readonly ActivitySource AuthSource = new("MyApp.Auth");

public async Task<HttpResponseMessage> GetRegistryTokenAsync(HttpRequestMessage unauthRequest, HttpClient client)
{
    using var parent = AuthSource.StartActivity("oci.auth.handshake", ActivityKind.Client);
    parent?.SetTag("gk.oci.auth", true);

    // Suppress default HttpClient instrumentation for the unauthenticated probe.
    using (OpenTelemetry.SuppressInstrumentationScope.Begin())
    {
        var probe = await client.SendAsync(unauthRequest); // returns 401 by design
        parent?.SetTag("probe.status", (int)probe.StatusCode);
    }

    // Follow-up authenticated request (let instrumentation record normally)
    ...
}
Pros: single high-level span summarizing handshake. Cons: you lose the granular 401 span timing (unless you manually add child spans yourself).
Why not Baggage?
OpenTelemetry has the notion of Baggage which can be added to the current Context. Baggage consists of Key-Value-Pairs (similar to tags). Baggage automatically flows to child activities (contrary to tags).
Baggage spills.
The default OpenTelemetry configuration for .NET also propagates baggage across process boundaries. In this case, the HttpClient instrumentation will add the Baggage as HTTP headers for outbound requests. That is a potential information leak. Use ordinary span tags for local classification. Reserve baggage for values you intentionally want every downstream service to see.
Security / privacy notes
- Never put credentials, tokens, or secrets in tags or baggage. Exporters may send them to external systems.
- Beware of path / URL fragments that may contain sensitive identifiers; consider redaction in processors.
Summary - what have we learned?
A blanket 4xx → Error mapping is sometimes too crude. For expected authentication challenge 401s you have several levers. The processor approach offers a pragmatic balance: keep the span (and its timing / metadata) but downgrade its status to Ok once you know the 401 is part of a normal auth handshake.
Basic setup (packages)
At minimum you will need:
- OpenTelemetry
- OpenTelemetry.Extensions.Hosting
- OpenTelemetry.Exporter.OpenTelemetryProtocol (or other exporter)
- OpenTelemetry.Instrumentation.AspNetCore
- OpenTelemetry.Instrumentation.Http
- OpenTelemetry.Instrumentation.SqlClient (and/or Npgsql etc.)
(Adjust depending on your stack.)
A quick note on System.Diagnostics.Activity & performance
All .NET OpenTelemetry tracing builds on System.Diagnostics.Activity and ActivitySource. The base types ship with the runtime and are highly optimized: when there is no listener, creating an Activity is essentially a no-op (very low overhead and often short‑circuited); when a listener is present, allocation and tag storage still aim to be efficient (arrays + pooling where possible). Most of the incremental cost you pay comes from:
- Sampling decision (made at start). If you use
ParentBasedSamplerwith a ratio sampler you can shed large volumes cheaply. - Export pipeline (serialization + network I/O). This usually dwarfs in-process span creation cost.
- Excessive high-cardinality tags / attributes (memory + export payload size).
- Synchronous exporters or very large batch sizes causing backpressure.
Practical tips:
- Keep span creation out of very tight inner loops unless diagnosing an issue.
- Use a ratio sampler (e.g., 5-10%) in production unless you genuinely need complete traces.
- Batch export (default OTLP exporter already does) and avoid blocking work inside processors.
- Prefer tags with bounded cardinality; put large blobs (queries, payloads) behind configuration flags.
Net: adjusting span status in a processor as shown below should not be a performance problem; the biggest risk is volume (too many spans exported) rather than this kind of conditional mutation.